Frank Morley
June 6, 2026
This is a post with executable Python code.
import sys
print(f"Python {sys.version}")

nums = list(range(1, 11))
squares = [n ** 2 for n in nums]

for n, sq in zip(nums, squares):
    print(f"{n:2d} → {sq:3d}")
Python 3.13.11 | packaged by Anaconda, Inc. | (main, Dec 10 2025, 21:21:58) [MSC v.1929 64 bit (AMD64)]
 1 →   1
 2 →   4
 3 →   9
 4 →  16
 5 →  25
 6 →  36
 7 →  49
 8 →  64
 9 →  81
10 → 100
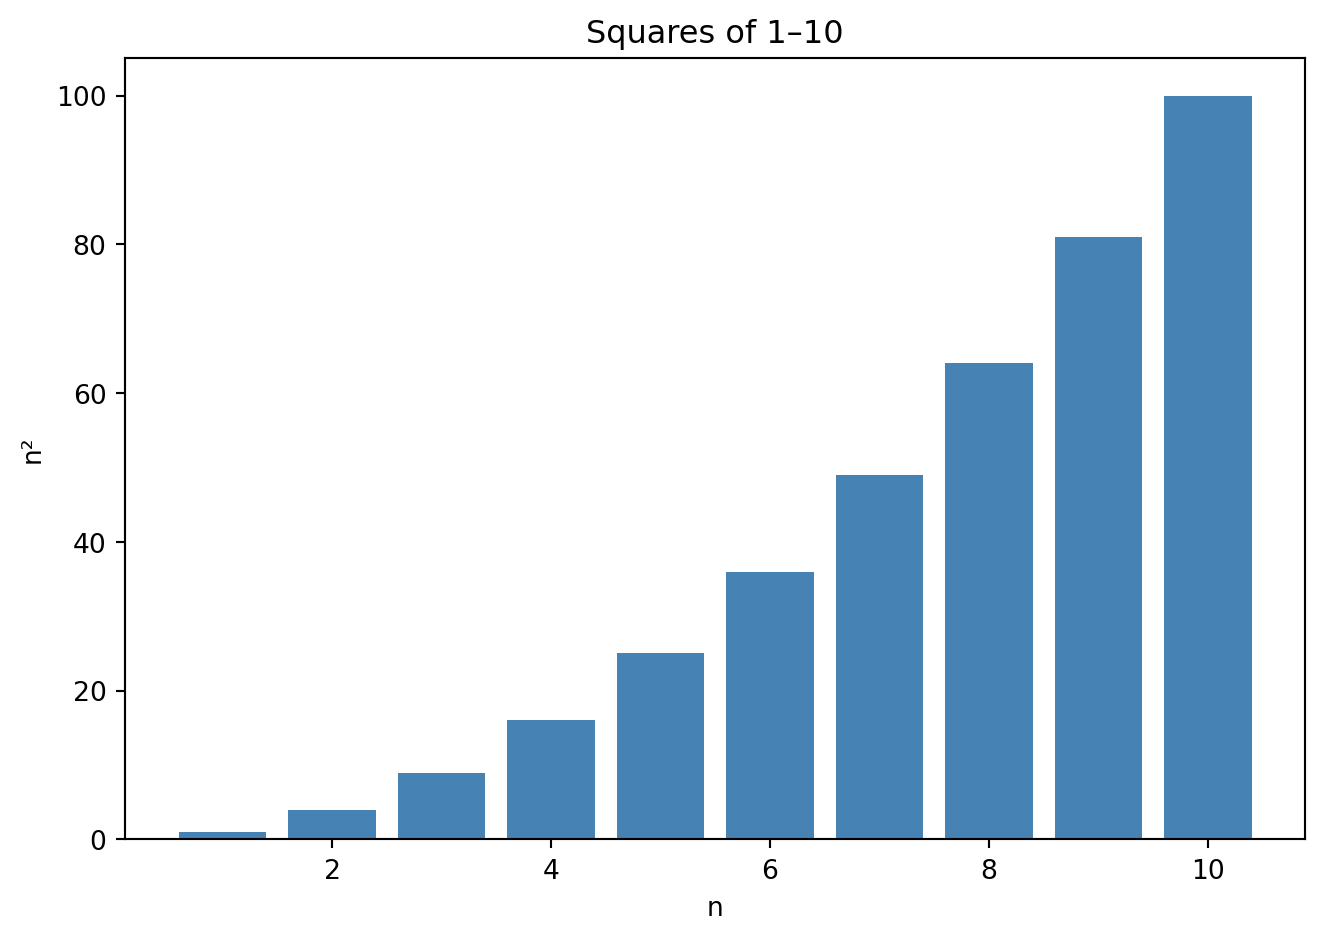
# Simple bar chart with matplotlib
import matplotlib.pyplot as plt

fig, ax = plt.subplots()
ax.bar(nums, squares, color="steelblue")
ax.set_xlabel("n")
ax.set_ylabel("n²")
ax.set_title("Squares of 1–10")
plt.tight_layout()
plt.show()